
Every table of corporate tax rates by country starts going stale on January 1. Rates are set in annual budgets, they usually take effect with the new year, and the comparison pages founders actually read are copied from last year's version with the title year edited. The numbers underneath often are not. This article is about how fast the ground moves, counted from our own dataset of 212 jurisdictions, and how to tell a live table from a photocopy.
Where the world clusters right now
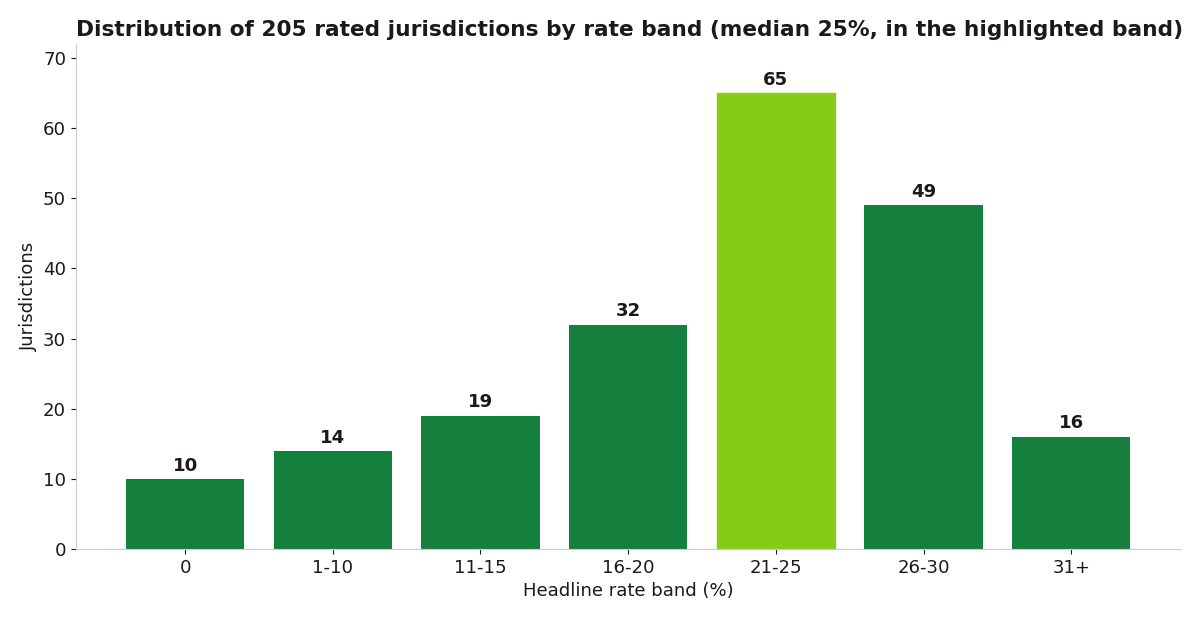
Of the 205 jurisdictions with a verified headline rate, the biggest single band is 21% to 25%, holding 65 countries. The median rate is 25% and the mean is 22.3%, pulled down by the 24 jurisdictions at 10% or less. Forty-seven countries charge 30% or more, and only 16 sit above 30%. That is the shape of the current table. The important word is current, because at least a few of these bars move every single year.
The January problem, in the data
Our dataset carries a year-effective field on every row, and the 2026 column shows why last year's table lies. Cyprus raised its rate from 12.5% to 15% on January 1, 2026, ending one of Europe's most quoted low rates; any page still listing Cyprus at 12.5% is a year out of date. Lithuania moved from 16% to 17% for 2026, a small change that still reprices every comparison it appears in. Nigeria's new Tax Act took effect on January 1, 2026 as well, zero-rating small companies while the headline stayed at 30% for now. None of these were surprises: all were legislated in advance, published, and still missed by most summary tables.
How to read any rates table, including ours
Three checks separate a maintained table from a copied one. Check the year on the row, not the page. A 2026 title over 2024 data is the standard failure; our dataset stamps every jurisdiction with its effective year and a verification date, September 14, 2026 for this edition. Check the rate type. A flat 25% and a progressive scale topping out at 25% are different taxes wearing the same headline; 174 of the 205 rated jurisdictions are flat, 18 tiered and 13 progressive. Check the small business column. Twenty-three countries record a separate small business rate, and a table that omits it overstates what a small company pays in exactly the countries founders ask about most.
The drift cuts both ways, which is easy to forget. A table frozen in a low-rate year flatters countries that have since raised rates, and a table frozen in a high-rate year libels countries that cut theirs to compete. Either way the reader makes a 2026 decision, where to incorporate, where to expand, what to budget for tax, using a map of a world that no longer exists. The median and mean in the chart above are this year's shape; next January they move again, and so will we.
What an honest table admits
A maintained table also admits what it could not verify. Seven of our 212 jurisdictions, Guinea, Somalia, South Sudan, Sudan, North Korea, Aruba and Syria, carry no headline rate in the dataset at all, because no current rate could be verified against a reliable source. Copied tables never have gaps like that; they fill every cell, because the cell was filled last year and the year before. A blank with a reason is worth more than a confident number with a hidden birthday. When you compare sources, treat the gaps as a quality signal: the publisher who leaves seven cells honestly empty is the one who checked the other 205.
Use a calculator that runs on the current table
Our TaxStack Calculator reads from this same dataset, so when a rate changes in January the calculator changes with it rather than waiting for someone to update a blog post. Enter a country and a profit figure and you get the current headline rate, the small business rate where one exists, and the rate type, with the effective year attached. If a number anywhere, here or elsewhere, does not carry a year, treat it as a rumor.
The full current table lives in our corporate tax rates by country table, and the distinction that makes old tables actively misleading, rather than just old, is covered in statutory vs effective corporate tax rate. Bookmark the data, not the screenshot: the screenshot expires every December 31.